brainframe-sys-tools
brainframe-sys-tools is a set of tools for monitoring a BrainFrame system and diagnosing deployment problems. It
measures inference speed, watches system resources, restarts BrainFrame when it stops responding, collects system
information for support, and opens SSH tunnels for remote access.
The tools are intended to run on the BrainFrame server, or on a machine that can reach it.
Installation
pip install brainframe-sys-tools
Requires Python 3.9 or newer (tested on Python 3.10).
Usage
brainframe-sys-tools <command> [options]
To list the options of a command, run brainframe-sys-tools <command> --help.
Note
Command names are written with hyphens, for example fps-monitor.
Commands
| Command | Purpose |
|---|---|
fps-monitor |
Measure the inference speed of each stream. |
perf-monitor |
Monitor CPU, memory, GPU, storage, and temperatures. |
service-monitor |
Watch BrainFrame and restart it when it stops responding. |
sys-info |
Collect system and BrainFrame information into a file. |
ssh-tunnel |
Open an SSH reverse tunnel to a remote server. |
fps-monitor
Shows the inference output speed, in frames per second (FPS), of each stream. The speed is measured through the BrainFrame REST API, alongside several diagnostic measurements.
brainframe-sys-tools fps-monitor
brainframe-sys-tools fps-monitor --server-url http://192.168.1.50 --duration 60
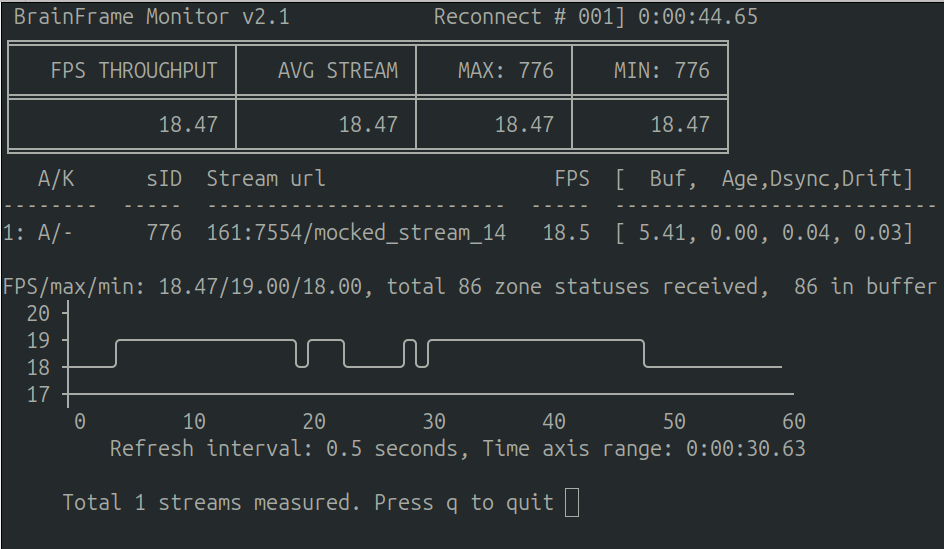
All time-based measurements (Buf, Age, Dsync, and Drift) are in seconds. They are calculated from the monitor's own history of recent results.
| Measurement | Meaning |
|---|---|
| Buf (local buffer duration) | How much time the monitor's history covers: the time between receiving the newest and the oldest zone status in the buffer. By default the buffer holds 100 samples. Once it is full, it acts as a sliding window, and Buf settles at the number of seconds taken to receive the last 100 frames. |
| Age (data freshness) | How long ago the monitor received the most recent zone status. |
| Dsync (pipeline latency) | The difference between the time the monitor received the latest zone status and the timestamp of its video frame. Dsync is only meaningful if the clocks of the two machines are synchronized. |
| Drift (stream clock drift) | The elapsed frame time minus the elapsed local time since monitoring began. A value that keeps growing more negative shows that stream processing is falling behind real time. |
| Option | Description |
|---|---|
--server-url SERVER_URL |
The BrainFrame server. Default: http://localhost. |
--refresh-interval SECONDS |
How often the display refreshes. Values that are too low can reduce accuracy. Default: 0.5. |
--times-hist-len COUNT |
The number of zone status samples to collect before results are displayed. Default: 100. |
--duration SECONDS |
The time span shown in the speed plot. Default: 30. |
--out OUT |
The file where the FPS history is saved. Default: brainframe_fps_history. |
--no-screen |
Print the results as plain text instead of using the full-screen terminal display. |
--version |
Show the version of the tool. |
The FPS history is appended to the output file, so you can review it later.
perf-monitor
Shows live system resource usage in the terminal.
brainframe-sys-tools perf-monitor
The monitor reports:
- System uptime
- CPU usage and temperature
- Memory usage, and the processes using the most memory
- Storage
- Intel integrated GPU (iGPU) usage
- NVIDIA GPU usage and temperature
- Board and NVMe drive temperatures
Some measurements need extra tools on the machine. If a tool is missing, that measurement is not shown.
| Measurement | Needs |
|---|---|
| NVIDIA GPU usage | nvidia-smi, which is installed with the NVIDIA driver. |
| Temperatures | sensors, from the lm-sensors package. |
| iGPU usage | intel_gpu_top, from the intel-gpu-tools package. It also needs sudo. |
A log file named <timestamp>_perf_monitor.log is written to the current directory, so you can review the history
after the session.
| Option | Description |
|---|---|
--memory |
Always show the top memory-consuming processes. |
service-monitor
Checks that BrainFrame is responding, and restarts it when it is not. This is useful for unattended systems.
brainframe-sys-tools service-monitor --log-path ~/bf-logs --interval 30 --threshold 90 --log-save
At each interval the monitor asks the server for its version and the latest zone statuses. If the server does not
answer within the threshold, the monitor restarts BrainFrame by running brainframe compose down followed by
brainframe compose up -d.
The monitor does not start BrainFrame by itself unless you give --start-now. A stale zone status is reported in the
heartbeat log, but it does not trigger a restart.
| Option | Description |
|---|---|
--server-url SERVER_URL |
The BrainFrame server. Default: http://localhost. |
--interval SECONDS |
How often to check the server. Default: 120. |
--threshold SECONDS |
How long to wait for a response before the server is considered unavailable and restarted. Default: 360. |
--log-path LOG_PATH |
The directory for log files. It must already exist. Default: the current directory. |
--start-now |
Start BrainFrame when the monitor starts. |
--log-save |
Before each restart, also save the BrainFrame logs and the system information. |
--restart-cron CRON |
Also restart BrainFrame on a schedule, written as a five-field cron string. |
The --restart-cron string has five fields: minute, hour, day of month, month, and day of week. An asterisk means
"every". Day of week is numbered from 0 for Monday to 6 for Sunday, following the APScheduler library. For example,
0 0 * * 3 restarts BrainFrame at midnight every Thursday.
The monitor writes these files to the log directory. The timestamp is the time the monitor, or the current monitoring session after a restart, started:
| File | Contents |
|---|---|
<timestamp>_brainframe_heartbeat.log |
Each heartbeat check and each restart. Always written. |
<timestamp>_brainframe.log |
The output of the brainframe compose commands run by the monitor. |
<timestamp>_sys.info |
System information collected before a restart. Written with --log-save. |
The monitor runs in the foreground. Run it in tmux, screen, or a system service if it must keep running after you
log out. The user running the monitor must be able to run brainframe compose commands.
sys-info
Collects information about the machine and the BrainFrame installation, prints it, and saves it to a file. Attach the file when you ask for support.
brainframe-sys-tools sys-info
brainframe-sys-tools sys-info --file my-server.info
| Option | Description |
|---|---|
-f FILE, --file FILE |
The file to save to. Default: sys.info. |
The report includes:
- The current date and time, in local time and UTC, and the uptime
- The Linux distribution, kernel, and C library version
- CPU, memory, and disk information
- NVIDIA driver and GPU details, and Intel GPU devices
- The Docker configuration and running containers
- The BrainFrame installation: its paths,
.env,docker-compose.yml, and loaded capsules - The BrainFrame server's version, license, capsules, and streams, read from the REST API on
localhost - The network address of the machine, and whether it can reach
aotu.ai
Warning
The report contains the contents of BrainFrame's configuration files and the stream configuration, which can include camera URLs and credentials. Review the file before you share it.
ssh-tunnel
Opens an SSH reverse tunnel, so that a remote server can reach a service on this machine. For example, it lets support staff open the BrainFrame web interface of a system that is behind a firewall.
brainframe-sys-tools ssh-tunnel -s ssh.example.com -u ubuntu -r 8088:localhost:80
With this command, a user on ssh.example.com can open localhost:8088 to reach port 80 of this machine. Press
Ctrl+C to close the tunnel.
| Option | Description |
|---|---|
-s SERVER_URL, --server-url SERVER_URL |
The SSH server to connect to. Always set this to your own server. |
-u USER, --user USER |
The user name on the SSH server. Default: ubuntu. |
-p PORT, --port PORT |
The SSH server port. Default: 22. |
-r RULE, --remoteforward RULE |
A forwarding rule, written as remote_port:localhost:local_port. Required. Repeat the option for more rules. |
-i FILE, --identity_file FILE |
The SSH private key file. |
-o OPTION, --option OPTION |
An SSH client option, for example -o ServerAliveInterval=120. Repeat the option for more. By default ExitOnForwardFailure=yes is set. |
Warning
A reverse tunnel gives the remote server access to the forwarded services on this machine. Only forward the ports you need, use a server that you trust, and close the tunnel when you are done.